Name
System Metrics (was Cluster Metrics)
Repo Name
systemmetrics
Description
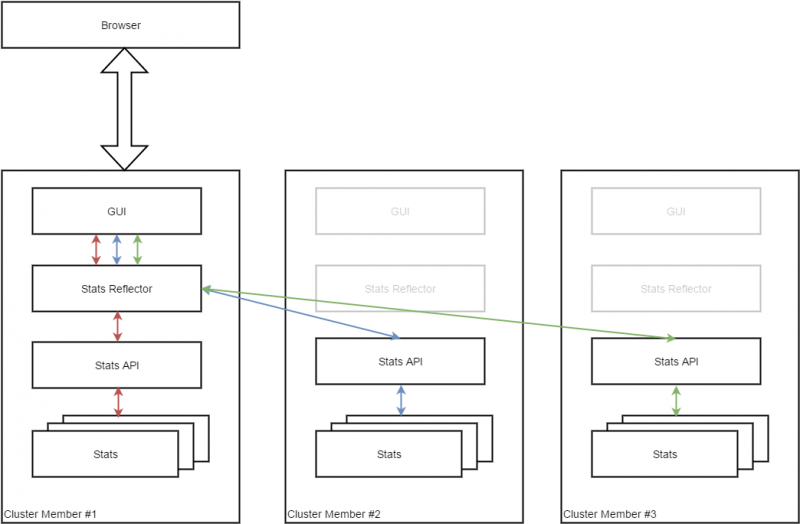
System Metrics is an application for monitoring Cluster behavior. Displays various metrics and alerts user when values crosses defined thresholds.
System Metrics consists of two parts:
- back-end (now called stats-reflector, but may change) is retrieving metrics data from various sources and publishes APIs for second part:
- GUI DLUX based UI is displaying metrics in various ways (gauge, line chart, table...)
Metrics List
Right now we are gathering and displaying these metrics:
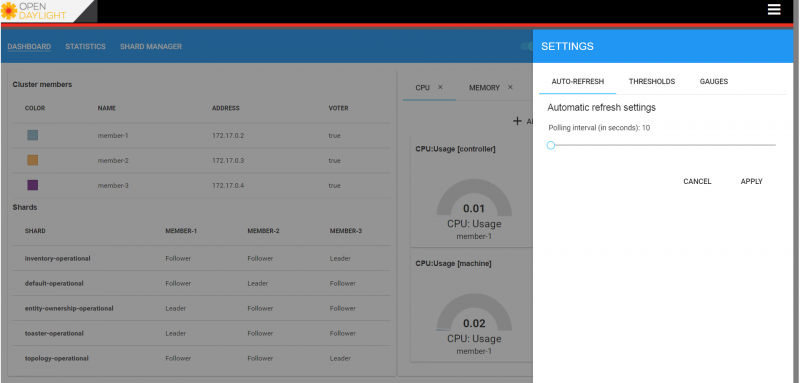
- CPU Usage (for controller and machine)
- Heap memoty usage
- NonHeap Memory usage
- Current Loaded Classes
- Total Loaded Classes
- Live Daemon Thread Count
- Live Thread Count
- Peak Thread Count
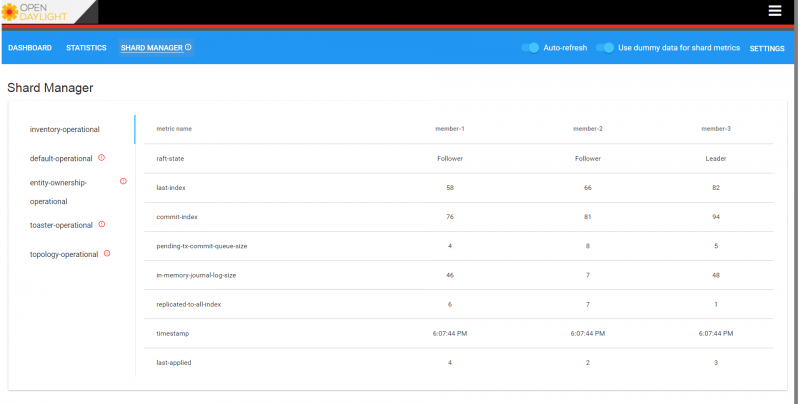
Shard statistics from Jolokia plugin
- Raft State (Leader or Follower)
- Last Index
- Commit Index
- Pending TX Commit Queue Size
- In Memory Journal Log Size
- Replicated To All Index
- Last Applied
GUI Screenshots
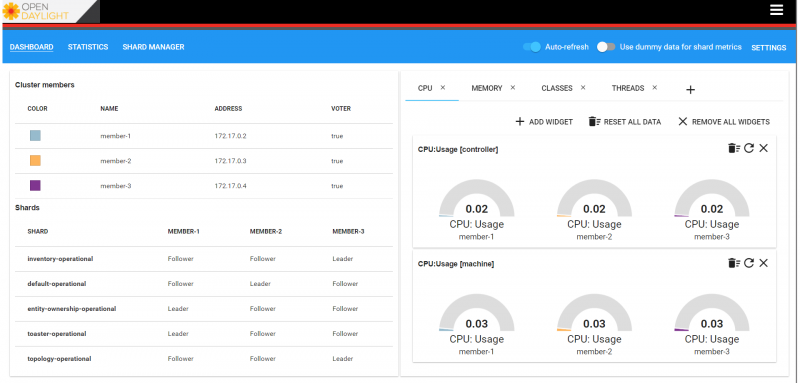
Dashboard page with list of cluster members, list of shards and gauges displaying actual values of various metrics.
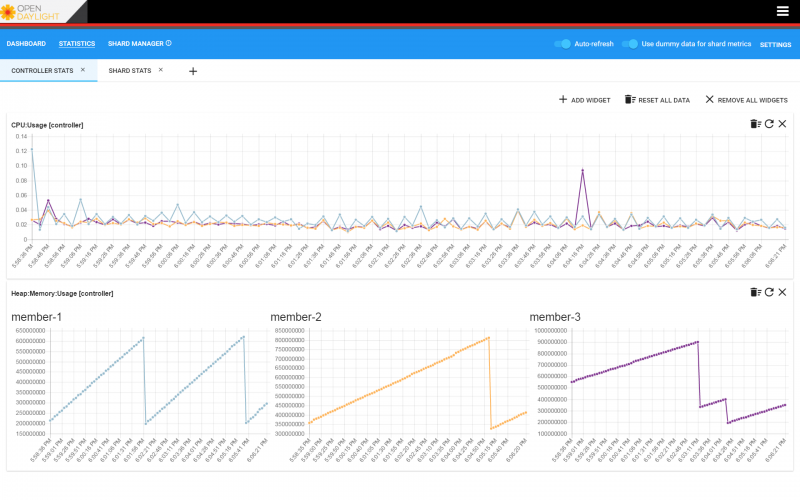
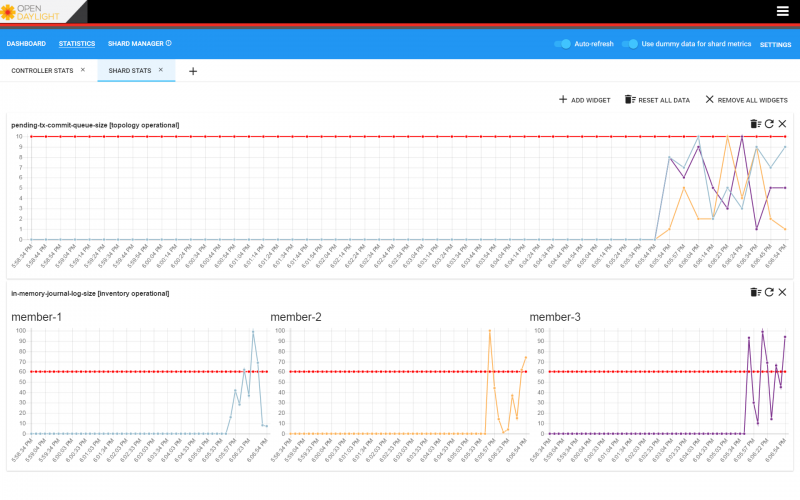
Statistics pages displaying two types of charts with controller and shard metrics.
Shard manager page displaying actual shard information with alerts.
Settings side panel.
Scope
- getting various statistics from cluster - machine, controllers and shards
- displaying those data in configurable UI
- showing alerts if something goes wrong
Resources Committed (developers committed to working)
- Daniel Malachovsky <dmalacho@cisco.com>
- Lubomir Balogh <lubalogh@cisco.com>
- Michal Kovacik <mikovaci@cisco.com>
- Stanislav Jamrich <sjamrich@cisco.com>
- Tyler Levine <tylevine@cisco.com>
Initial Committers
- Daniel Malachovsky <dmalacho@cisco.com>
- Stanislav Jamrich <sjamrich@cisco.com>
- Tyler Levine <tylevine@cisco.com>
Vendor Neutral
This code base contains only the standard ODL copyright notice as it was started with the idea of eventually moving it to open source.